XSLT Debugging Perspective
Oxygen provides a special layout for the debugging mode. It displays the XML source and the XSLT stylesheet side by side, and also offers dedicated XSLT debugging views and toolbars.
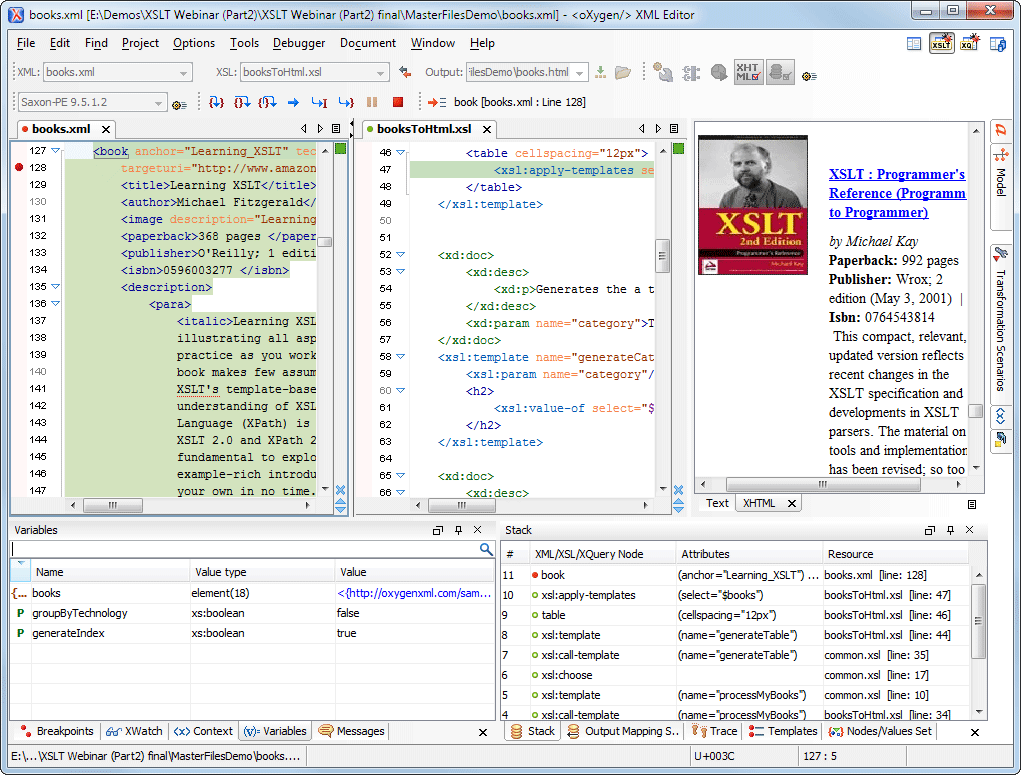
Full Control over the XSLT Debugging Process
Oxygen provides all XSLT debugger capabilities (step into, step over, step out, run, run to cursor, run to end, pause, stop). During the debugging process, the current XML and XSLT nodes are shown (see the right part in the image above) with specific details (an arrow icon to show the action performed on it, the name, the resource, and the line). By clicking the arrow, the text sections corresponding to the XML and XSLT stylesheet nodes are highlighted in the editor.
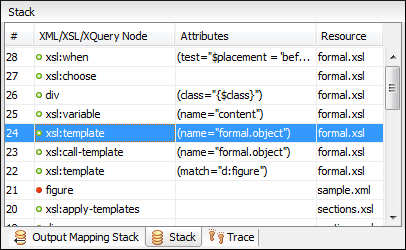
XSLT Call Stack View
The current stack containing both XSLT stylesheet and XML source nodes can be seen at any time during XSLT debugging. The advantage of this approach is that the scope of the source in which a stylesheet instruction is being executed is easily visible (the last red colored node in the stack).
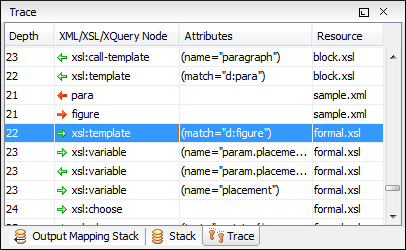
Trace History View
Entering and leaving node events are logged and available in a view to show the history of the processor execution. You can click the entries in the list to see the corresponding node in the editor.
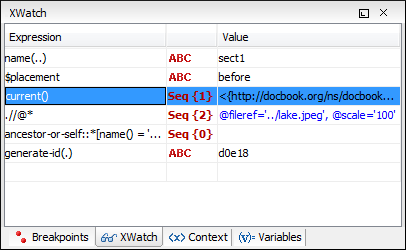
XPath Watch View
You can add custom XPath expressions to the XWatch view . The XPath expressions are evaluated automatically and the XSLT debugger updates the values dynamically as the processor changes its XML source context. The results of an evaluation can be a single value, a tree fragment, or a list of nodes and are presented in the Node Set view. The XWatch view is useful when debugging the expressions for template matches.
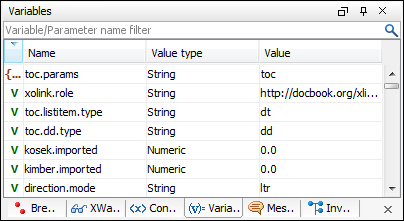
XSLT Variables View
The debugger lists all XSLT variables and parameters that are visible in the current XSLT context, along with their scope and actual value. This view is updated as the XSLT processor changes the context during the transformation.
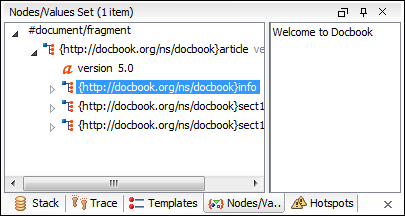
Tree View for Presenting Node Set Values
The Nodes/Values Set view displays XSLT node set values in a tree-like fashion. It is used in conjunction with the used in relation with the Variables view and XWatch view. This view is useful for debugging stylesheets that keep intermediary results in variables, such as DocBook.
You can easily locate nodes from the tree by simply clicking on them and the editor will select the corresponding XML source nodes.