Invocation Tree View
The Invocation Tree view shows a top-down call tree that represents how XSLT instructions or XQuery expressions are processed. If the view is not displayed, it can be opened by selecting it from the menu.
The entries in the invocation tree include a few possible icons that indicate the following:
 -
Points to a call whose inherent time is insignificant compared to its total time.
-
Points to a call whose inherent time is insignificant compared to its total time. - Points
to a call whose inherent time is significant compared to its total time (greater than 1/3rd
of its total time).
- Points
to a call whose inherent time is significant compared to its total time (greater than 1/3rd
of its total time).
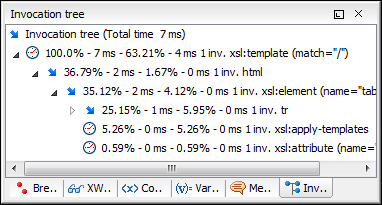
Every entry in the invocation tree includes textual information that depends on the XSLT/XQuery profiler settings:
- A percentage number of the total time that is calculated with respect to either the root of the tree or the calling instruction.
- A total time measurement in milliseconds or microseconds. This is the total execution time that includes calls into other instructions.
- A percentage number of the inherent time that is calculated with respect to either the root of the tree or the calling instruction.
- An inherent time measurement in milliseconds or microseconds. This is the inherent execution time of the instruction.
- An invocation count that shows how often the instruction has been invoked on this call-path.
- An instruction name that contains also the attributes description.
The Invocation Tree view also includes the following contextual menu
actions:
- Export to HTML
- Selecting this option will save the profiling data as XML and then apply an XSLT stylesheet to render the report as HTML. These stylesheets are included in the subfolder: [OXYGEN_INSTALL_DIR]/frameworks/profiler/. You can use them to customize your own report based on the profiling raw data.
- Export to XML
- Use this option to save the profiling data as an XML file in a specified location.
- View settings
- Opens the XSLT/XQuery Profiler preferences page that allows you to configure various profiling settings.