Performance Profiling of XSLT Stylesheets and XQuery Documents
Whether you are trying to identify a performance issue that is causing your production XSLT/XQuery transformation to not meet customer expectations or you are trying to proactively identify issues prior to deploying your XSLT/XQuery transformation, using the XSLT/XQuery profiler feature is essential to helping you save time and ultimately ensure a better performing, more scalable XSLT/XQuery transformation.
The XSLT/XQuery profiling feature can use any available XSLT/XQuery processor that can be used for debugging and it is available from the debugging perspective.
Enabling the Profiler
Enabling and disabling the profiler is controlled by the  /
/ Profiler button from the debugger
Control toolbar. The XSLT/XQuery profiler is off by default. This option is not
available during a debugger session so you need to set it before starting the
transformation. For information about a common debugging procedure, see Steps in a Typical Debugging Process.
Profiler button from the debugger
Control toolbar. The XSLT/XQuery profiler is off by default. This option is not
available during a debugger session so you need to set it before starting the
transformation. For information about a common debugging procedure, see Steps in a Typical Debugging Process.
Profiling Information Views
Immediately after enabling the profiler, two new information views are added to the current debugger information views:
- Invocation tree view on left side
- Hotspots view on right side
Profiling data is available only after the transformation ends successfully.
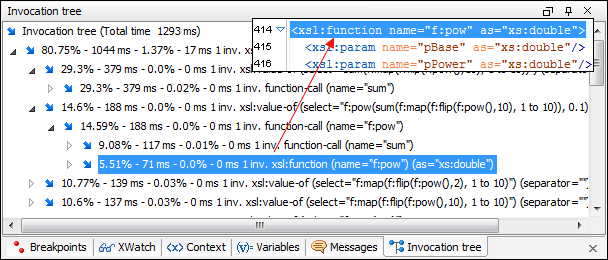
On the left side (Invocation tree view), you can examine how style instructions are processed. This result view is also named call-tree, as it represents the order of style processing. The profiling result shows the duration time for each of the style-instruction including the time needed for its called children.
On the right side (Hotspots view), you can immediately spot the time the processor spent in each instruction. As an instruction usually calls other instructions, the used time of the called instruction is extracted from the duration time of the caller (the hotspot only presents the inherent time of the instruction).
Source Backmapping
In either the Invocation tree or Hotspots view, you can use the backmapping feature to find the XSLT stylesheet or XQuery expression definition. Clicking the selected item causes Oxygen XML Editor to highlight the XSLT stylesheet or XQuery expression source line where the instruction is defined.
Saving and Customizing Profiling Data
The profiling data can be saved (exported) into XML and HTML format. In either the Invocation tree or Hotspots view, right-click anywhere in the view and select Export to XML or Export to HTML. The HTML report can be customized based upon the profiling raw data. When you select Export to HTML, Oxygen XML Editor will save it as XML and apply an XSLT stylesheet to render the report as XML. You can customize these stylesheets to suit your needs. By default, they are located in: [OXYGEN_INSTALL_DIR]/frameworks/profiler/.
Other Profiling Notes
- If you want to change the XSLT/XQuery profiler settings, use the contextual menu and choose the corresponding View settings entry.
- Profiling exhaustive transformations may run into an OutOfMemory error due to
the large amount of information being collected. If this is the case, you can close
unused projects when running the profiling or use high values for Java VM options
-Xmsand-Xmx. If this does not help you can shorten your source XML file and try again.
Resources
For more information about the XSLT/XQuery Profiler, watch our video demonstration: