Debugger Layout
The XML and XSL files are displayed in Text mode. The other modes (Author mode, Grid mode) are available only in the Editor perspective.
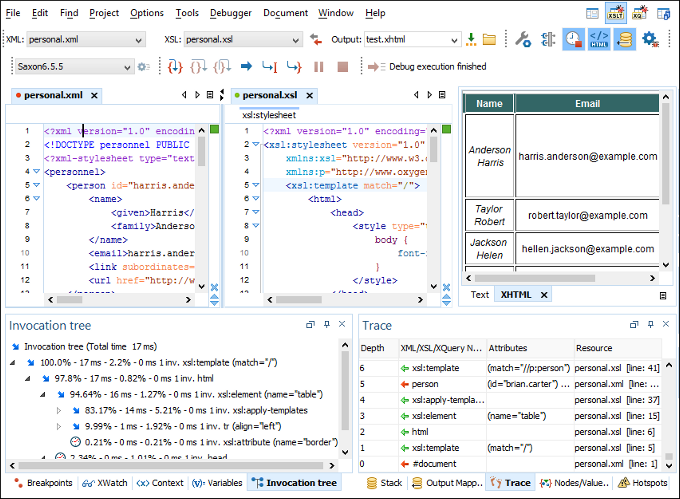
The XSLT/XQuery Debugger perspective contains the following components:
- Source Document View (XML) - Displays and allows the editing of XML files (documents).
- XSLT/XQuery Document View (XSLT/XQuery) - Displays and allows the editing of XSL files (stylesheets) or XQuery documents.
- Output View - Displays the output that results from inputting a
document (XML) and a stylesheet (XSL) or XQuery document in the transformer. The
transformation result is written dynamically while the transformation is processed (using
the
 Run
button on the Control toolbar). Several actions are available in the contextual
menu for this view, including Find/Replace,
Run
button on the Control toolbar). Several actions are available in the contextual
menu for this view, including Find/Replace,  Copy, and
  Format and Indent.
There are two types of output views: a Text view (with XML syntax highlights) and XHTML view. For large outputs, the XHTML view can be disabled (see Debugger Settings).
Format and Indent.
There are two types of output views: a Text view (with XML syntax highlights) and XHTML view. For large outputs, the XHTML view can be disabled (see Debugger Settings). - Control Toolbar - Contains a variety of actions to help you configure and control the debugging process.
- Information Views - The information views at the bottom of the editor display various types of information to help you understand the transformation process.
XML documents and XSL stylesheets or XQuery documents that were opened in the Editor perspective are automatically sorted into the first two panes. When multiple files of each type are opened, the individual documents and stylesheets are separated using the familiar tab management system that you are used to in the Editor perspective. Selecting a tab brings the document or stylesheet into focus and enables editing without the need to go back to the Editor perspective.
In Debugger mode, the normal editor toolbar is not available. However, functions are still accessible from the Document menu and the contextual menus.
Bookmarks are replaced in the Debugger perspective by breakpoints.
During debugging, the current execution node is highlighted in both document (XML) and XSLT/XQuery views.